Solutions
Drone survey and mapping services, end to end
Eight capabilities, one field team. Every mission is planned to the accuracy your design needs and processed in-house, so the file that reaches your engineers is the file they can work from.
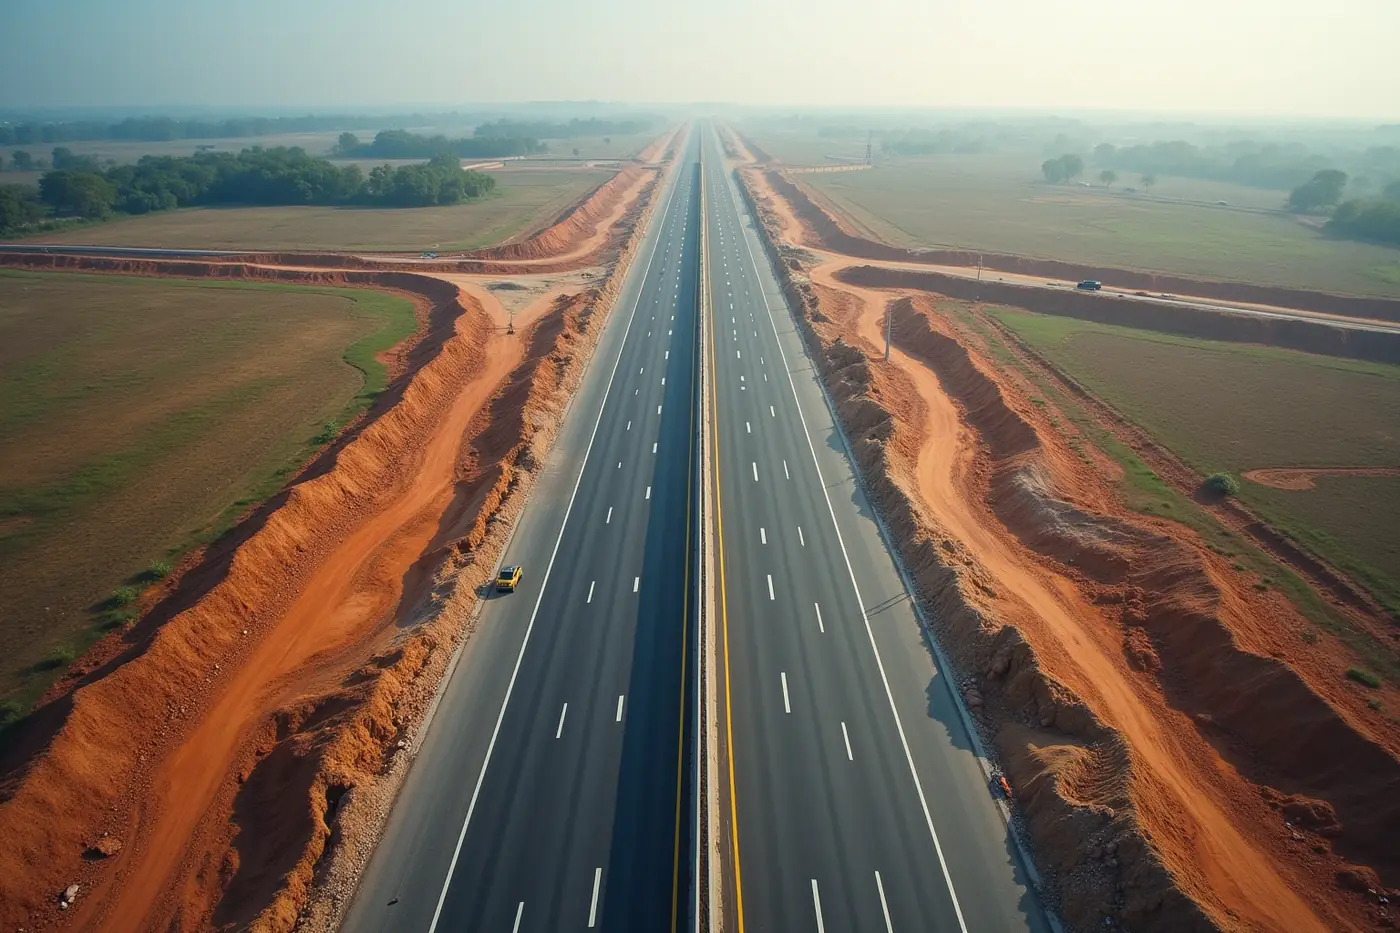
In short
A drone survey captures a site from the air at a known accuracy, then turns that capture into files your engineers can measure from. Flying Pixel runs eight capabilities: drone survey and mapping, topographic and DGPS land survey, photogrammetry, LiDAR, hydrographic survey, GIS and data processing, inspection and monitoring, and project films. Every mission is planned to the ground sample distance your tolerance needs.
Flying survey-grade missions in India
Mapped across corridors, sites and catchments
Enterprise and government projects delivered
Survey-grade aircraft in the fleet
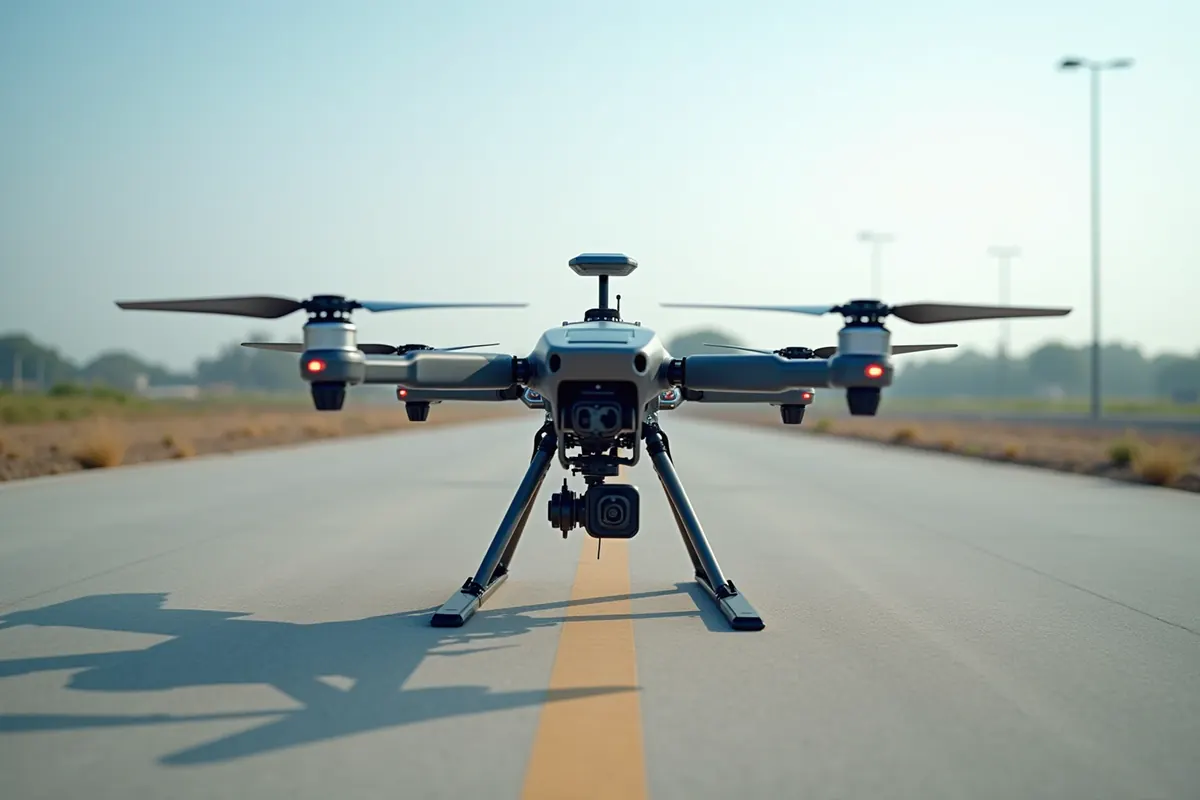
01 · Drone Survey & Mapping
Drone survey and UAV mapping
The full survey, from flight planning and ground control to the file your engineers open.
A drone survey replaces weeks of walking a site with instruments. One flight captures the whole area at a known accuracy, so you measure from a single consistent dataset instead of stitching together separate visits.
Missions are planned to the ground sample distance the deliverable needs, flown with RTK or PPK positioning, and tied to surveyed ground control points. Checkpoints held back from processing are used to report the accuracy actually achieved, not the accuracy hoped for.
Typical deliverables
- Orthomosaic
- Point cloud
- DTM
- Contours
- Volumes
02 · Topographic & Land Survey
Topographic survey, contour survey and DGPS land survey
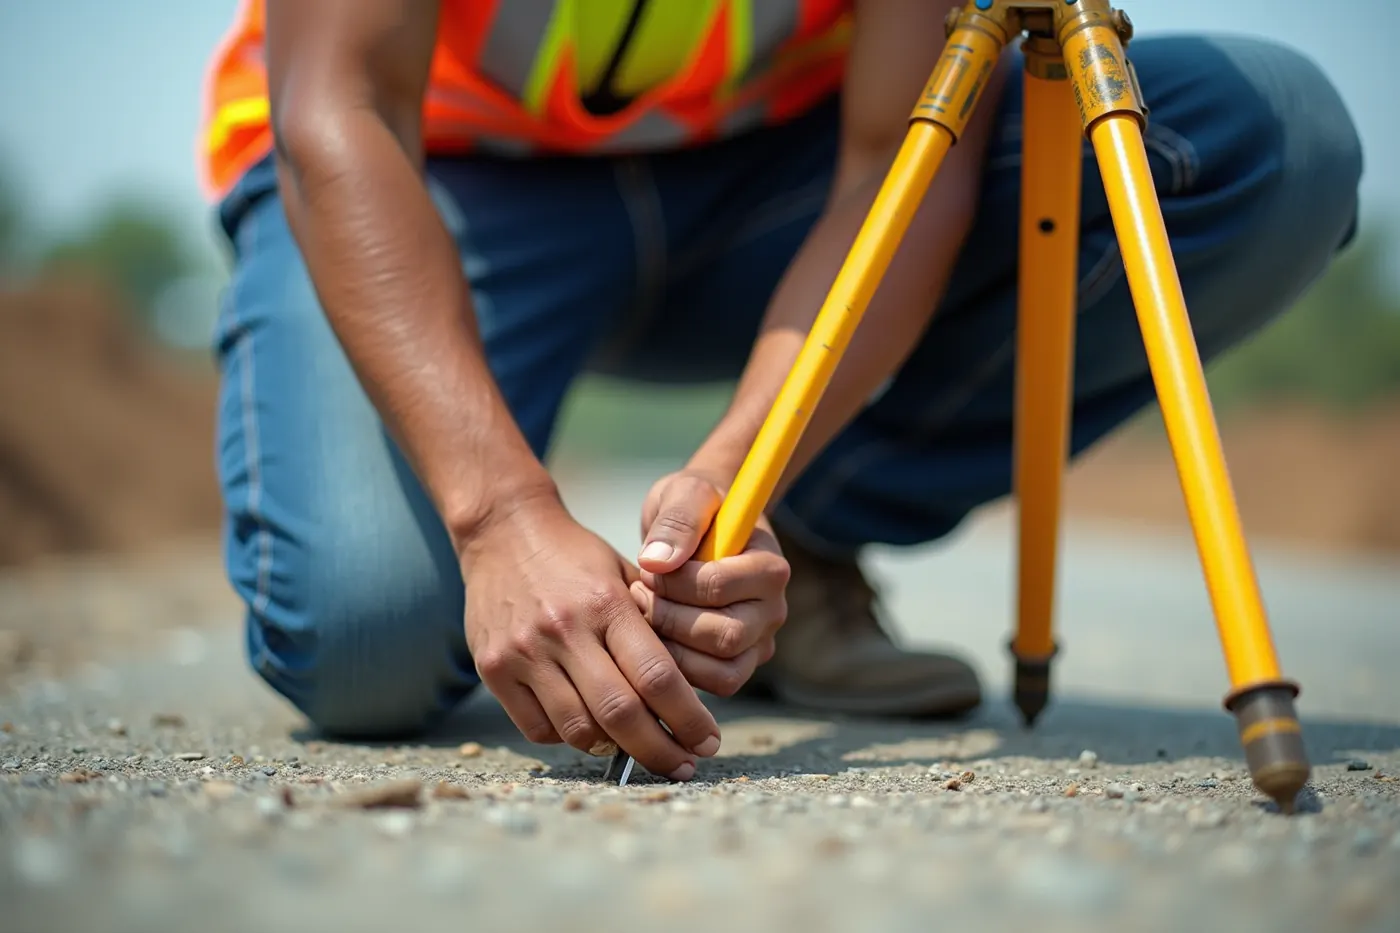
Contours and terrain models on your datum, with the control report that proves them.
A topographic survey records the shape of the ground: levels, breaklines, contours and existing features. Design, drainage and earthwork all start from it, so an error here propagates through every downstream quantity.
DGPS-grade control is established across the site and the aerial capture is registered to it. Ground is classified out from vegetation and structures before contours are generated at the interval you specify, then delivered in your EPSG code and units.
Typical deliverables
- Contours (DXF)
- DTM
- Spot levels
- Control report
- Cadastral overlay
03 · Photogrammetry & Aerial Mapping
Photogrammetry and aerial mapping
High-overlap imagery processed into measurable orthomosaics and 3D models.
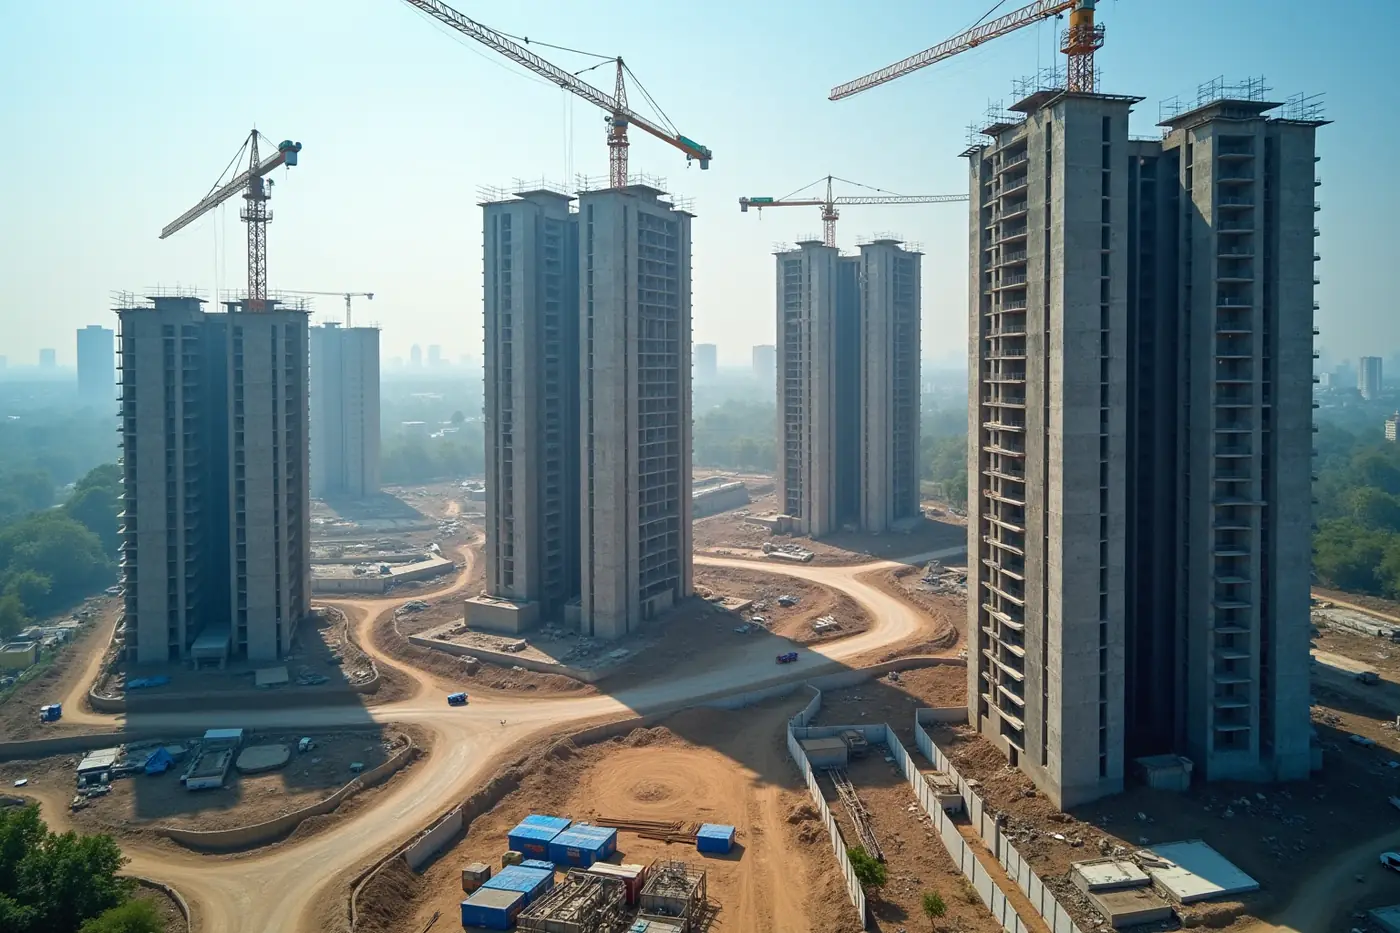
Photogrammetry turns overlapping aerial photographs into measurable geometry. It is the right tool for open ground, stockpiles, construction sites and anything where you need a true-colour base map you can measure directly.
Flights are planned for consistent forward and side overlap at 1 to 3 cm ground sample distance. Tie points and ground control drive the bundle adjustment, producing an orthomosaic, a dense point cloud and a textured mesh from the same capture.
Typical deliverables
- Orthomosaic (GeoTIFF)
- Dense point cloud
- 3D mesh (OBJ)
- DSM
- Volumes
04 · LiDAR Survey
LiDAR survey and aerial laser scanning
Ground level under vegetation, where photogrammetry alone returns canopy.
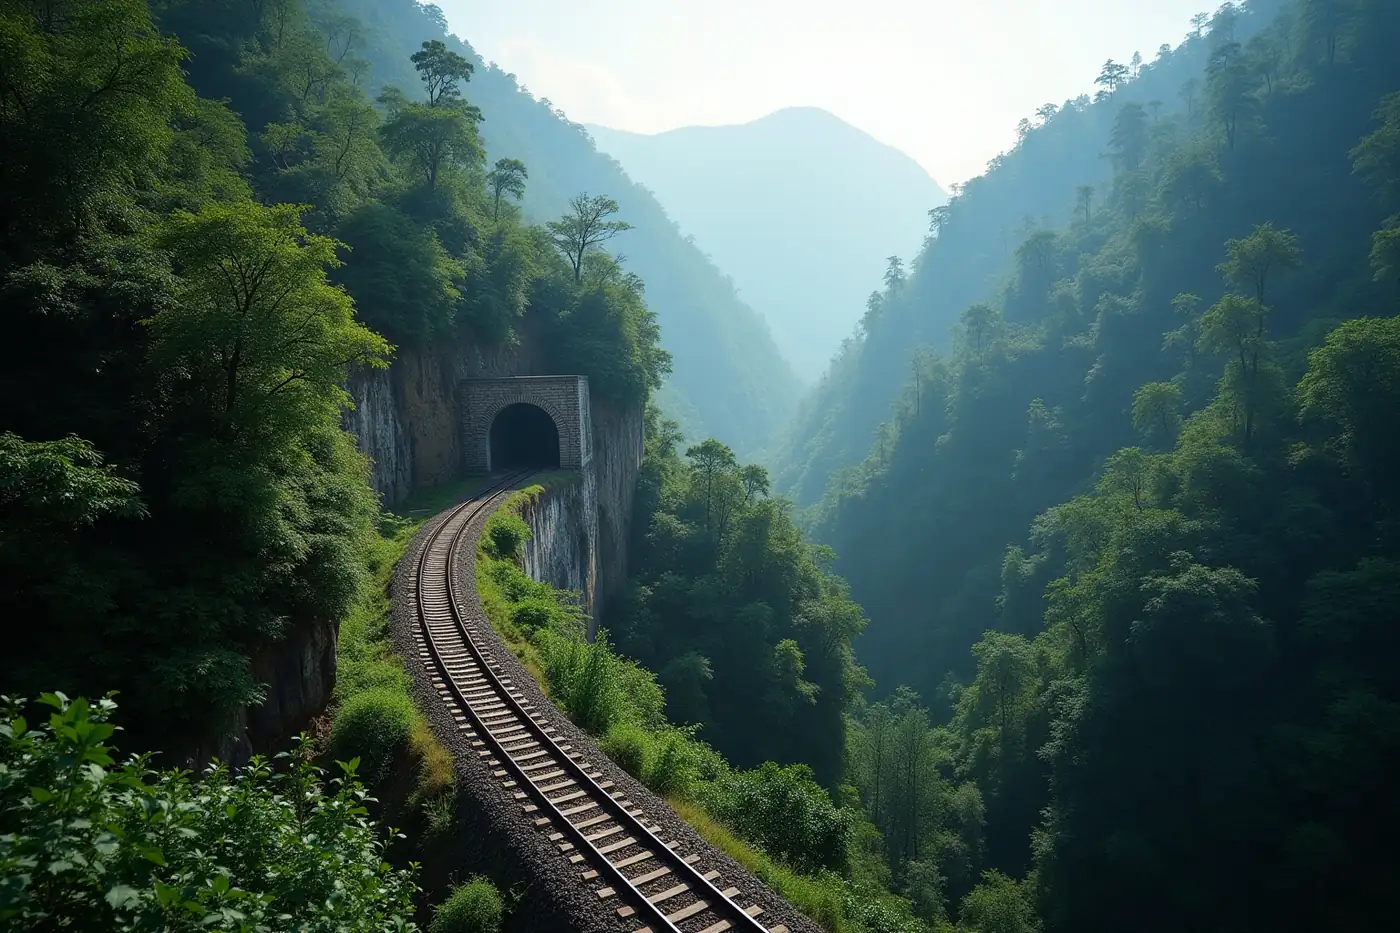
LiDAR pulses find gaps in vegetation and record returns from the ground beneath it. On forested ghat sections, reservoir slopes and overgrown corridors it is the only aerial method that gives a true bare-earth surface.
Multiple returns per pulse are classified into ground, vegetation and structure. The classified ground class becomes the terrain model. We flew this method for Central Railway across two ghat corridors and for EDF Energy at the Sawale hydro project.
Typical deliverables
- Classified point cloud (LAS / LAZ)
- Bare-earth DTM
- Contours
- Cross sections
05 · Hydrographic & Water Survey
Hydrographic survey and bathymetric mapping
One continuous surface across the waterline, above it and below it.
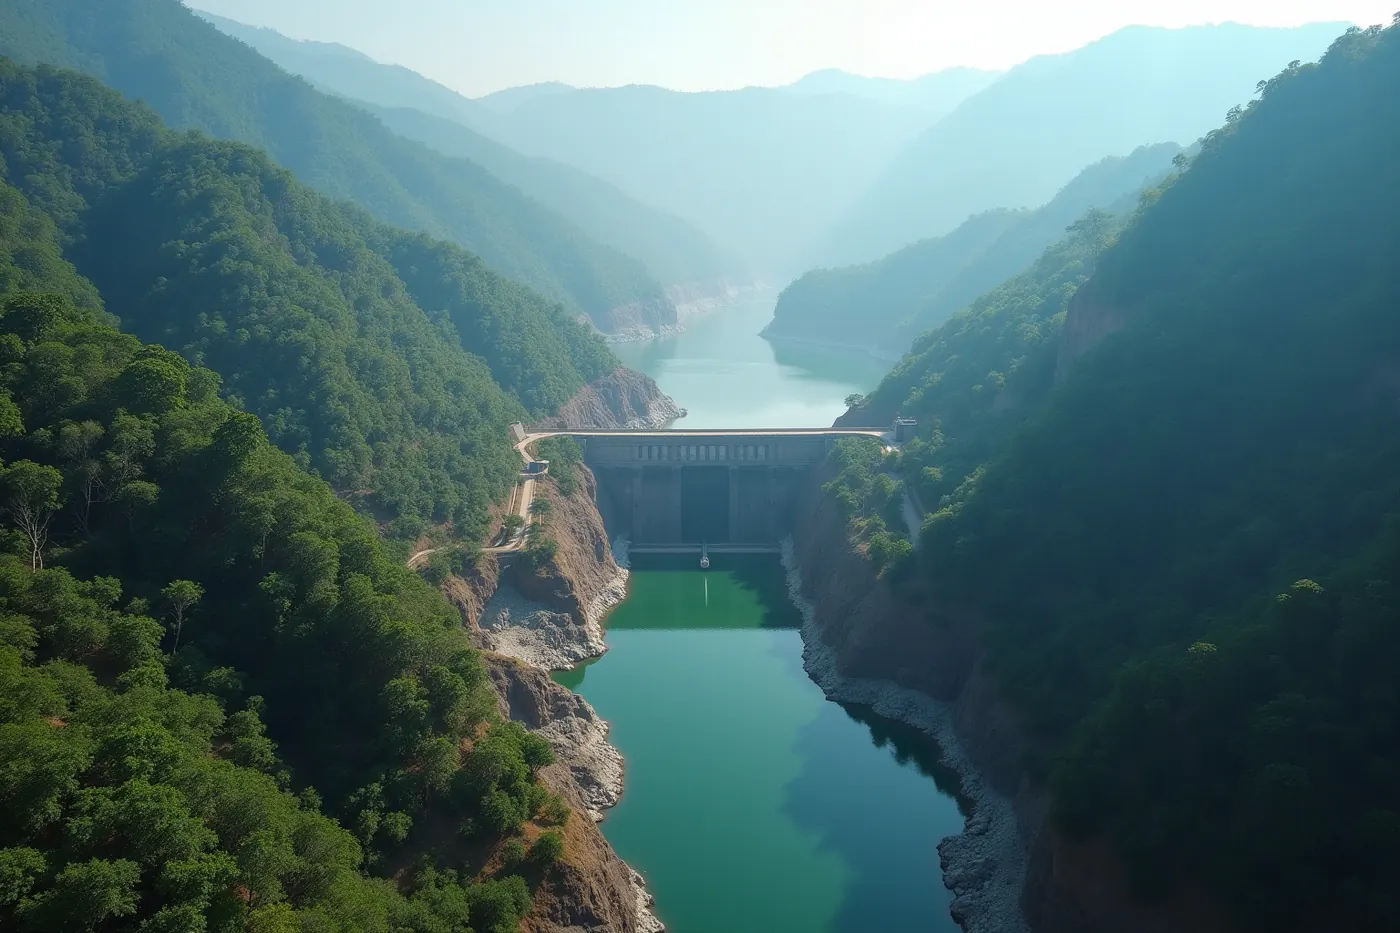
Water projects need the bed and the bank in the same model. A reservoir capacity study, a drainage design or a dredging quantity all depend on a surface that does not break at the shoreline.
Aerial capture covers the land and the exposed bank. Bathymetric data covers the submerged bed. The two are merged on a common datum into one continuous terrain model, so volumes compute across the full extent without a gap at the waterline.
Typical deliverables
- Bathymetric surface
- Merged DTM
- Capacity tables
- Contours
- Cross sections
06 · GIS & Data Processing
GIS services and geospatial data processing
Classification, QA and delivery into the GIS, CAD and BIM platforms your team already runs.
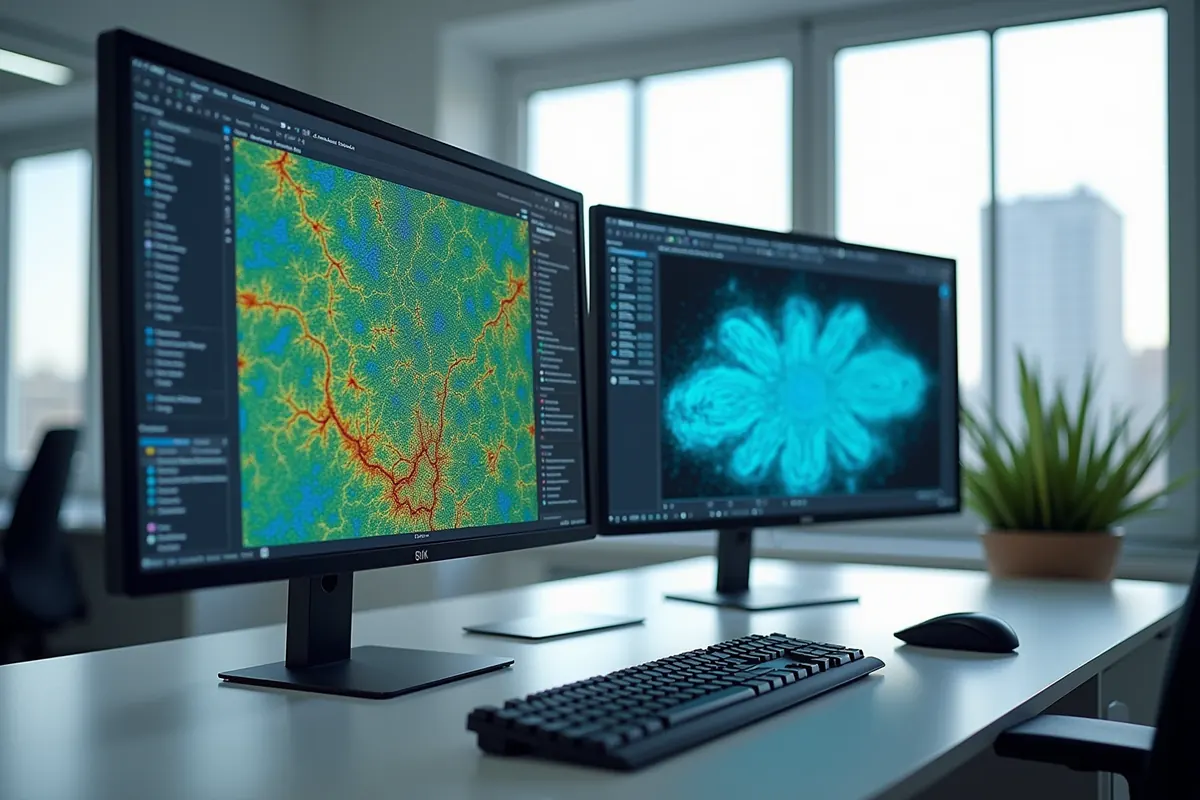
Raw capture is not a deliverable. The value is in the processing: classifying the cloud, checking it against control, structuring the layers and handing over something that opens correctly on the first try.
Processing runs in-house. Nothing is subcontracted and project data is not passed to a third party. Output is written to your EPSG code, datum and layer convention, so it drops into your existing project structure rather than needing rework.
Typical deliverables
- Classified data
- Layered DXF
- GeoTIFF
- KML
- CSV attribute tables
07 · Inspection & Monitoring
Drone inspection and construction progress monitoring
Repeat flights on a fixed path, so month two is comparable to month one.
Monitoring only works if the captures are comparable. Flying the same path at the same height on a schedule turns a series of site visits into a measurable time series of progress and quantities.
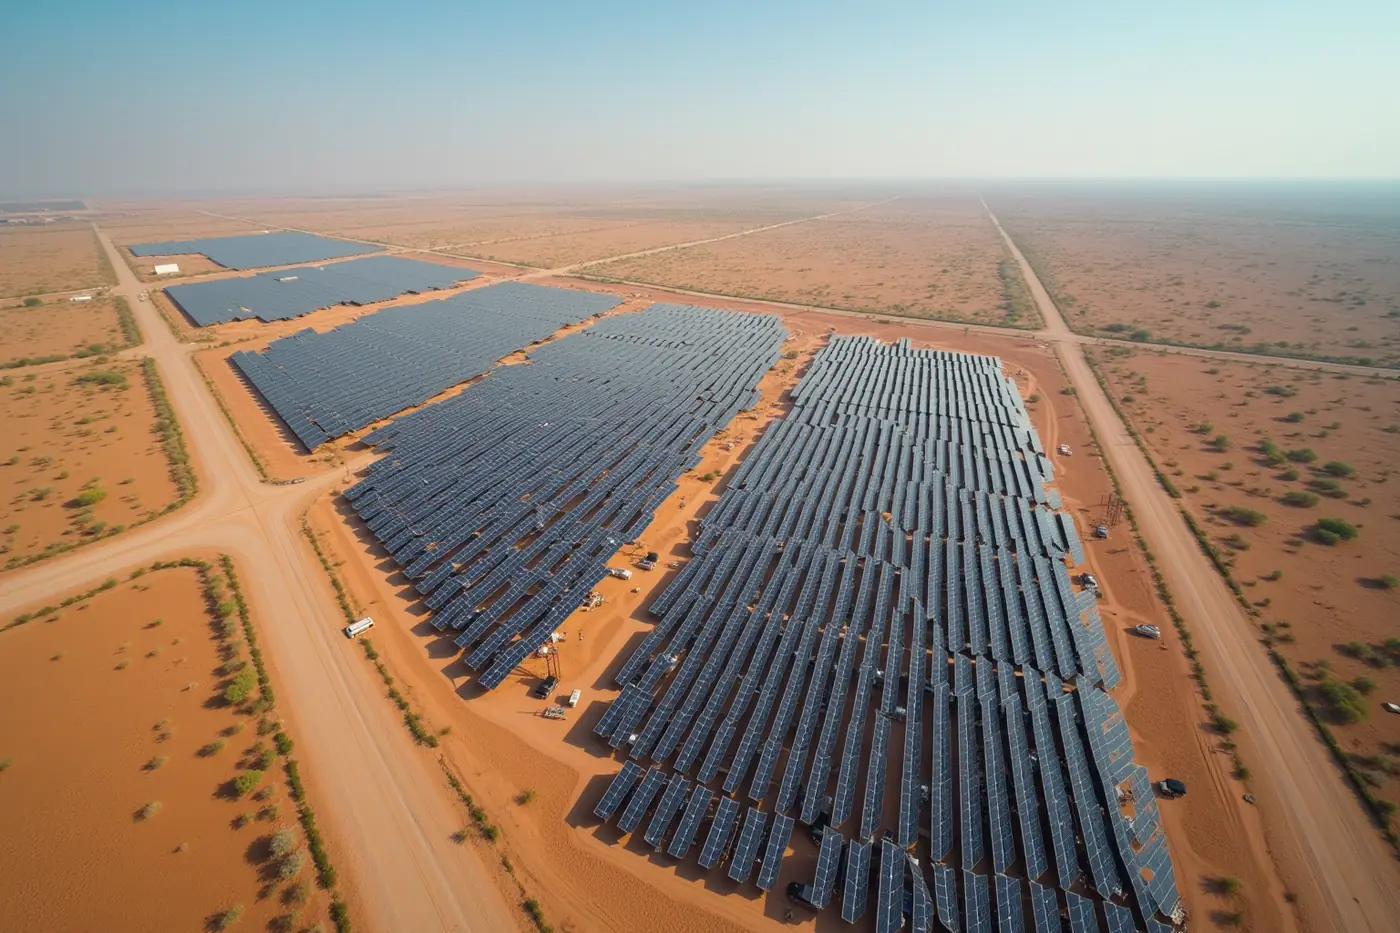
Progress flights repeat a saved mission so each dataset aligns with the last. Thermal capture adds defect detection on solar fields and electrical assets. We run this pattern monthly for L&T across the Navi Mumbai Airport build.
Typical deliverables
- Progress orthomosaic
- Volume change
- Thermal imagery
- Defect report
08 · Project Films & Aerial
Project aerial films and corporate video production
Aerial photography and films of the project, shot by a crew that already flies it for survey.
Project media for boards, tenders, investors and milestones. The same crew that flies the survey knows the site, the airspace clearance and the safe lines, so a media capture does not start from zero.
Capture is planned around the construction sequence so the shot list matches what is actually built that month. Delivered as graded 16:9 masters with vertical crops for internal and social use.
Typical deliverables
- Graded film
- Stills library
- 16:9 master
- 9:16 crop
How we work
From permissions to deliverables, handled end to end.
Five steps, the same on a 60 km corridor and a single site. Nothing is subcontracted.
- 01
Scope and permissions
We confirm the area, the accuracy spec and the deliverable list, then handle airspace clearance and site permissions.
- 02
Control and flight plan
Ground control is laid across the site and the mission is planned to the ground sample distance your tolerance requires.
- 03
Field capture
A two-person crew flies the mission with RTK or PPK positioning, with checkpoints surveyed independently.
- 04
Processing and QA
Processing, classification and checkpoint review run in-house, against your stated tolerance.
- 05
Delivery in your formats
Point clouds, terrain models and contours arrive in your EPSG code and file types, with the control report attached.
By sector
The same capabilities, tuned to your project type.
A solar park and a forested hydro slope need different sensors and different flight plans. Pick your sector to see how the work changes.
Choosing a sensor
LiDAR or photogrammetry, and when to fly both
Neither is better in general. They answer different questions, and the deciding factor is almost always whether vegetation is between the sensor and the ground.
| Consideration | Photogrammetry | LiDAR |
|---|---|---|
| Ground under vegetation | Returns canopy, not ground | Multiple returns per pulse reach bare earth |
| Colour information | True colour, directly measurable | Intensity, colour only if paired with a camera |
| Primary output | Orthomosaic, dense cloud, textured mesh | Classified point cloud, bare-earth DTM |
| Best suited to | Open ground, stockpiles, construction sites | Forested corridors, reservoir slopes, overgrown right of way |
| Relative cost to fly | Lower | Higher, and worth it where canopy blocks the view |
| Typical use together | Base map and visual record | Terrain surface beneath the vegetated sections |
References
The standards behind these claims
Certification, datum and coordinate system are not things a survey company gets to define for itself. These are the bodies that do.
- Directorate General of Civil Aviation
The authority that certifies remote pilots and sets drone operating rules in India.
- Survey of India
India's national survey and mapping organisation, and the source of the national geodetic and vertical datum work our deliverables reference.
- EPSG Geodetic Parameter Dataset
The registry behind the EPSG codes every deliverable is written to, which is how a coordinate system is stated without ambiguity.
Links checked and confirmed live on 12 August 2026.
FAQ
Technical questions we get asked
If your question is not here, ask it in the enquiry form and a surveyor will answer it.
What is DGPS surveying?
DGPS is differential GPS: a receiver on a known point broadcasts corrections to a roving receiver, cancelling most of the error common to both. In practice it takes satellite positioning from metre level to centimetre level. It is how a survey gets tied to a real coordinate system rather than floating on uncorrected GPS.
What is the difference between DGPS and GNSS?
GNSS is the family of satellite constellations a receiver can listen to, including GPS, GLONASS, Galileo and BeiDou. DGPS describes the correction technique applied on top. So they are not alternatives: a modern survey receiver uses GNSS signals and applies differential correction, which is what brings the position down to centimetre level.
Is RTK a type of DGPS?
Yes, RTK is a carrier-phase form of differential correction, applied in real time from a base station or network. PPK does the same arithmetic after the flight instead of during it. Both resolve each photo centre or laser pulse to centimetre level before processing starts, rather than trusting the drone's onboard GPS.
What is in a DGPS survey report?
The control report records where the control points were placed, how they were observed, which coordinate system and datum they are tied to, and what the independent checkpoints returned once processing was finished. That last part is the important one, because it states the accuracy actually achieved rather than the accuracy the method is capable of.
What is a contour survey?
A contour survey records the shape of the ground as lines joining points of equal elevation. It is what drainage design, earthwork quantities and setting-out all start from, so an error here propagates into every downstream number. Contours are generated from a classified terrain model and delivered at whatever interval your design requires.
What is a contour survey used for?
Grading and earthwork design mainly. The contour interval tells you how the water will run, where cut and fill will fall, and whether a proposed level works against the existing ground. On solar parks it drives the module table layout, and on highways it drives the cut and fill volumes that get certified.
What contour interval should I ask for?
That follows the terrain and the design. Flat ground usually needs a tighter interval to be useful, because a wide interval on a near-level site shows almost nothing. Steep ground can carry a wider one. Tell us what the contours are for and we will recommend an interval, then deliver at whatever you specify.
What is a topographic survey?
A topographic survey records the shape and features of a site: levels, breaklines, contours, and the existing structures and services visible on it. It is the base dataset a design is drawn on. Ours are delivered as contours in DXF, a terrain model, spot levels and a control report, written to your EPSG code.
What is the difference between a topographic survey and a cadastral survey?
A topographic survey describes the physical shape of the ground. A cadastral survey describes legal boundaries and ownership. They answer different questions and are often needed together, since a design has to sit inside the boundary as well as on the terrain. We can overlay cadastral information onto the topographic deliverable.
What is photogrammetry used for?
Photogrammetry turns overlapping aerial photographs into measurable geometry. It is the right tool for open ground, stockpiles, construction sites and anywhere you want a true-colour base map you can measure directly. It produces an orthomosaic, a dense point cloud and a textured 3D mesh from the same capture.
What is aerial photogrammetry?
Aerial photogrammetry is photogrammetry flown from the air rather than shot from the ground. Images are captured with deliberate forward and side overlap so the same feature appears in several frames, and the geometry between those frames is what allows a measurable 3D model to be reconstructed from flat photographs.
Is LiDAR better than photogrammetry?
Neither is better in general; they answer different questions. Photogrammetry gives true-colour, measurable imagery and works well on open ground. LiDAR pulses find gaps in vegetation and record returns from the ground beneath it, so it is the only aerial method that returns a true bare-earth surface under canopy. On mixed sites we fly both and merge them.
When do I need LiDAR instead of photogrammetry?
Whenever vegetation blocks the view of the ground. Forested ghat sections, reservoir slopes and overgrown corridors all return treetops from photogrammetry, which is the wrong surface for penstock alignment or reservoir capacity. We flew LiDAR for Central Railway across two ghat corridors and for EDF Energy at the Sawale hydro project for exactly this reason.
Is photogrammetry the same as 3D scanning?
They reach a similar output by different means. 3D scanning, including LiDAR, measures distance directly with a laser. Photogrammetry infers geometry from overlapping photographs. Photogrammetry carries real colour information and is cheaper to fly; laser scanning penetrates vegetation and works regardless of light and texture.
What is a point cloud?
A point cloud is the raw measured surface: millions of individual points, each with a coordinate and usually a colour or intensity value. It is what terrain models, cross sections and clash checks are derived from. We deliver it classified, as LAS or LAZ, so ground is already separated from vegetation and structures.
What does classified point cloud data mean?
Classification tags each point with what it represents: ground, vegetation, building, and so on. It matters because the bare-earth surface used for terrain modelling is built only from the ground class. An unclassified cloud looks impressive and is difficult to design from, since treetops and rooftops sit in the same surface as the ground.
What is a digital terrain model, and how is it different from a DSM?
A digital terrain model represents bare earth with vegetation and structures removed. A digital surface model represents everything the sensor saw, including canopy and buildings. Earthwork and drainage design need the terrain model. Volumes over a stockpile or a progress comparison usually want the surface model. We deliver whichever the task needs, or both.
What is an orthomosaic?
An orthomosaic is a set of aerial photographs corrected for terrain and camera geometry and stitched into one image tied to a coordinate system. Unlike a plain aerial photo it has consistent scale, so measurements taken on it are real. It is delivered as GeoTIFF and drops straight into GIS and CAD as a base layer.
What is ground sample distance?
Ground sample distance is how much real ground one image pixel covers. At 1.8 cm GSD, each pixel is about 1.8 cm across on the ground. It is set by flight height and sensor, and it sets the smallest detail that can be resolved, so it is chosen from the deliverable rather than from a default mission template.
Why do you need ground control points?
Ground control ties the aerial capture to your real coordinate system, so the model sits where the site actually is rather than merely being internally consistent. Extra points are surveyed and then deliberately held out of processing as checkpoints. Comparing the finished model against those points is what produces an honest accuracy statement.
What is a hydrographic or bathymetric survey?
It maps the bed beneath a water surface. Water projects need the bed and the bank in one continuous model, because a reservoir capacity study, a drainage design or a dredging quantity all break down if the surface has a gap at the waterline. Aerial capture covers the land, bathymetry covers the submerged bed, and the two merge on a common datum.
Can you survey both above and below the waterline?
Yes, and delivering them as one surface is the point. Aerial capture covers the land and the exposed bank, bathymetric data covers the submerged bed, and the two are merged on a common datum into a single terrain model. Volumes then compute across the full extent without a discontinuity at the shoreline.
What GIS services do you provide?
Processing, classification, quality checking and delivery into the platforms your team already runs. Raw capture is not a deliverable; the value is in classifying the cloud, checking it against control, structuring the layers and handing over something that opens correctly first time. Output is written to your EPSG code, datum and layer convention.
Can you deliver into our existing CAD, GIS or BIM setup?
Yes. Deliverables are written to the EPSG code, datum, units and layer convention you specify, so they drop into your existing project structure rather than needing rework on arrival. Tell us the coordinate system and the layer naming you use and it is set up before processing starts, not corrected afterwards.
Request a survey
Have a site to survey?
Send the site boundary and your accuracy spec. We reply within one business day with an approach, a deliverable list and a quote.